What was your dataset?
Load your dataset in with the function below. The input is the date the dataset was issued. You should be able to get this from the tt_available() function.
critic <- readr::read_tsv('https://raw.githubusercontent.com/rfordatascience/tidytuesday/master/data/2020/2020-05-05/critic.tsv')
## Parsed with column specification:
## cols(
##   grade = col_double(),
##   publication = col_character(),
##   text = col_character(),
##   date = col_date(format = "")
## )
user_reviews <- readr::read_tsv('https://raw.githubusercontent.com/rfordatascience/tidytuesday/master/data/2020/2020-05-05/user_reviews.tsv')
## Parsed with column specification:
## cols(
##   grade = col_double(),
##   user_name = col_character(),
##   text = col_character(),
##   date = col_date(format = "")
## )
items <- readr::read_csv('https://raw.githubusercontent.com/rfordatascience/tidytuesday/master/data/2020/2020-05-05/items.csv')
## Parsed with column specification:
## cols(
##   num_id = col_double(),
##   id = col_character(),
##   name = col_character(),
##   category = col_character(),
##   orderable = col_logical(),
##   sell_value = col_double(),
##   sell_currency = col_character(),
##   buy_value = col_double(),
##   buy_currency = col_character(),
##   sources = col_character(),
##   customizable = col_logical(),
##   recipe = col_double(),
##   recipe_id = col_character(),
##   games_id = col_character(),
##   id_full = col_character(),
##   image_url = col_character()
## )
## Warning: 2 parsing failures.
##  row          col           expected actual                                                                                                  file
## 4472 customizable 1/0/T/F/TRUE/FALSE    Yes 'https://raw.githubusercontent.com/rfordatascience/tidytuesday/master/data/2020/2020-05-05/items.csv'
## 4473 customizable 1/0/T/F/TRUE/FALSE    Yes 'https://raw.githubusercontent.com/rfordatascience/tidytuesday/master/data/2020/2020-05-05/items.csv'
villagers <- readr::read_csv('https://raw.githubusercontent.com/rfordatascience/tidytuesday/master/data/2020/2020-05-05/villagers.csv')
## Parsed with column specification:
## cols(
##   row_n = col_double(),
##   id = col_character(),
##   name = col_character(),
##   gender = col_character(),
##   species = col_character(),
##   birthday = col_character(),
##   personality = col_character(),
##   song = col_character(),
##   phrase = col_character(),
##   full_id = col_character(),
##   url = col_character()
## )
Villagers
skimr::skim(villagers)
## Skim summary statistics
##  n obs: 391
##  n variables: 11
##
## ── Variable type:character ───────────────────────────────────────────────────────
##     variable missing complete   n min max empty n_unique
##     birthday       0      391 391   3   5     0      361
##      full_id       0      391 391  11  17     0      391
##       gender       0      391 391   4   6     0        2
##           id       0      391 391   2   8     0      391
##         name       0      391 391   2   8     0      391
##  personality       0      391 391   4   6     0        8
##       phrase       0      391 391   2  10     0      388
##         song      11      380 391   7  16     0       92
##      species       0      391 391   3   9     0       35
##          url       0      391 391  60  66     0      391
##
## ── Variable type:numeric ─────────────────────────────────────────────────────────
##  variable missing complete   n  mean    sd p0   p25 p50   p75 p100
##     row_n       0      391 391 239.9 140.7  2 117.5 240 363.5  483
##      hist
##  ▇▇▇▇▇▇▇▇
Personalities by Species
species_count <- villagers %>%
  group_by(species)  %>%
  summarize(species_count = n()) %>%
  arrange(species_count)

datatable(species_count)
level_order <- villagers %>%
  group_by(species) %>% count() %>%
  arrange(desc(n)) %>%
  pull(species)

villagers %>%
  mutate(species=factor(species, levels=level_order)) %>%
  ggplot() + aes(x=species, y=personality, color=personality) %>%
  geom_count() +
   theme_light() + theme(legend.position = "none") +
  theme(axis.text.x = element_text(angle = 90))

villagers %>% select(name, species, personality, url) %>%
  mutate(combo = paste(species, personality)) %>% select(name, combo, url) -> villager_index

unique_combos <- villagers %>%
  group_by(species, personality) %>% summarize(n=n()) %>%
  filter(n == 1) %>% mutate(combo=paste(species, personality)) %>%
  inner_join(y=villager_index, by=c("combo")) %>% ungroup()

out_image <- unique_combos %>%
  ggplot() + aes(x=species, y=personality, image=url, name=name) +
  geom_count() +
  geom_raster(fill="white", color="black") +
  geom_image(asp=1.2, size=0.03) +
   theme_minimal() + theme(legend.position = "none") +
  theme(axis.text.x = element_text(angle = 90)) + labs(title="There can be only one", subtitle = "Unique Personality/Species combos in Animal Crossing")
## Warning: Ignoring unknown parameters: colour
out_image

ggsave(plot=out_image, filename = "unique_animal_personalities.pdf", width=10, height = 5)
pers_vil <- villagers %>%
  group_by(personality, species) %>%
  summarize(count=n()) %>%
  #filter(count==1) %>%
  arrange(species)

pers_vil %>%
  arrange(desc(count)) %>%
  datatable()
Items
skimr::skim(items)
## Skim summary statistics
##  n obs: 4565
##  n variables: 16
##
## ── Variable type:character ───────────────────────────────────────────────────────
##       variable missing complete    n min max empty n_unique
##   buy_currency    1014     3551 4565   5   5     0        2
##       category       0     4565 4565   4  11     0       21
##       games_id       0     4565 4565   2   2     0        1
##             id       0     4565 4565   3  29     0     4200
##        id_full    1528     3037 4565   8  34     0     2704
##      image_url    1528     3037 4565  56  82     0     2672
##           name       0     4565 4565   3  29     0     4200
##      recipe_id    3977      588 4565   4  20     0      102
##  sell_currency      36     4529 4565   5   5     0        1
##        sources    3663      902 4565   3  71     0      125
##
## ── Variable type:logical ─────────────────────────────────────────────────────────
##      variable missing complete    n mean                        count
##  customizable    3992      573 4565 0.45 NA: 3992, FAL: 316, TRU: 257
##     orderable    2775     1790 4565 0.45 NA: 2775, FAL: 976, TRU: 814
##
## ── Variable type:numeric ─────────────────────────────────────────────────────────
##    variable missing complete    n    mean       sd p0  p25  p50  p75
##   buy_value    1014     3551 4565 6959.65 34326.09 40  870 1300 2700
##      num_id       0     4565 4565 3661.62  2187.95 12 1722 3569 5607
##      recipe    3977      588 4565    4.71     6.49  1    2    3    6
##  sell_value      36     4529 4565 2261.38 11313.23  5  240  390 1000
##     p100     hist
##  1200000 ▇▁▁▁▁▁▁▁
##     7443 ▇▇▇▇▆▆▇▇
##       90 ▇▁▁▁▁▁▁▁
##    3e+05 ▇▁▁▁▁▁▁▁
library(tidyverse)
items %>% ggplot() +
  aes(x=category, y=buy_value) +
  geom_boxplot() +
  ylim(c(0,75000)) +
  theme(axis.text.x  = element_text(angle = 90))
## Warning: Removed 1094 rows containing non-finite values (stat_boxplot).

Most Expensive Items
This was the original code in my tweet:
library(gt)

 items %>%
  top_n(10, buy_value) %>%
  arrange(desc(buy_value)) %>%
  select(name, sell_value, buy_value, category, image=image_url) %>%
  gt() %>%
   text_transform(
    locations = cells_body(vars(image)),
    fn = function(x) {
      web_image(
        url = x,
        height = 50
      )
    }
  )
| name |
sell_value |
buy_value |
category |
image |
| Royal Crown |
300000 |
1200000 |
Hats |
 |
| Crown |
250000 |
1000000 |
Hats |
 |
| Gold Armor |
80000 |
320000 |
Dresses |
 |
| Golden Casket |
80000 |
320000 |
Furniture |
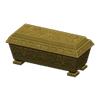 |
| Grand Piano |
65000 |
260000 |
Furniture |
 |
| Golden Toilet |
60000 |
240000 |
Furniture |
 |
| Blue Steel Staircase |
NA |
228000 |
Furniture |
 |
| Iron Bridge |
NA |
228000 |
Furniture |
 |
| Red Steel Staircase |
NA |
228000 |
Furniture |
 |
| Red Zen Bridge |
NA |
228000 |
Furniture |
 |
| Zen Bridge |
NA |
228000 |
Furniture |
 |
Here’s a function.
most_expensive <- function(category_name=NULL, price_category=buy_value){

  if(!is.null(category_name)){
    items <- items %>%
      filter(category == category_name)
  }

  items %>%
  top_n(10, {{price_category}}) %>%
  arrange(desc({{price_category}})) %>%
  select(name, sell_value, buy_value, category, image=image_url) %>%
  gt() %>%
   text_transform(
    locations = cells_body(vars(image)),
    fn = function(x) {
      web_image(
        url = x,
        height = 50
      )
    }
  )

}
Reproducing the above table
most_expensive()
| name |
sell_value |
buy_value |
category |
image |
| Royal Crown |
300000 |
1200000 |
Hats |
 |
| Crown |
250000 |
1000000 |
Hats |
 |
| Gold Armor |
80000 |
320000 |
Dresses |
 |
| Golden Casket |
80000 |
320000 |
Furniture |
 |
| Grand Piano |
65000 |
260000 |
Furniture |
 |
| Golden Toilet |
60000 |
240000 |
Furniture |
 |
| Blue Steel Staircase |
NA |
228000 |
Furniture |
 |
| Iron Bridge |
NA |
228000 |
Furniture |
 |
| Red Steel Staircase |
NA |
228000 |
Furniture |
 |
| Red Zen Bridge |
NA |
228000 |
Furniture |
 |
| Zen Bridge |
NA |
228000 |
Furniture |
 |
Most Expensive Furniture
most_expensive("Furniture")
| name |
sell_value |
buy_value |
category |
image |
| Golden Casket |
80000 |
320000 |
Furniture |
 |
| Grand Piano |
65000 |
260000 |
Furniture |
 |
| Golden Toilet |
60000 |
240000 |
Furniture |
 |
| Blue Steel Staircase |
NA |
228000 |
Furniture |
 |
| Iron Bridge |
NA |
228000 |
Furniture |
 |
| Red Steel Staircase |
NA |
228000 |
Furniture |
 |
| Red Zen Bridge |
NA |
228000 |
Furniture |
 |
| Zen Bridge |
NA |
228000 |
Furniture |
 |
| Elaborate Kimono Stand |
55000 |
220000 |
Furniture |
 |
| Golden Seat |
50000 |
200000 |
Furniture |
 |
Most Expensive Hats
library(gt)
most_expensive("Hats")
| name |
sell_value |
buy_value |
category |
image |
| Royal Crown |
300000 |
1200000 |
Hats |
 |
| Crown |
250000 |
1000000 |
Hats |
 |
| Gold Helmet |
50000 |
200000 |
Hats |
 |
| Blue Rose Crown |
12000 |
48000 |
Hats |
 |
| Gold Rose Crown |
12000 |
48000 |
Hats |
 |
| Snowperson Head |
7000 |
28000 |
Hats |
 |
| Knight's Helmet |
3750 |
15000 |
Hats |
 |
| Dark Cosmos Crown |
3360 |
13440 |
Hats |
 |
| Chic Rose Crown |
2880 |
11520 |
Hats |
 |
| Purple Hyacinth Crown |
2880 |
11520 |
Hats |
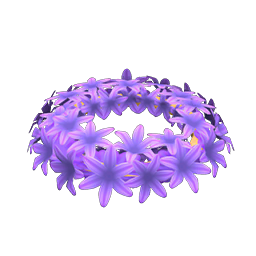 |
| Purple Pansy Crown |
2880 |
11520 |
Hats |
 |
| Purple Windflower Crown |
2880 |
11520 |
Hats |
 |
| Simple Mum Crown |
2880 |
11520 |
Hats |
 |
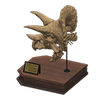
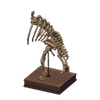
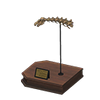
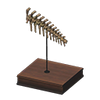
Most Expensive Fossils
most_expensive("Fossils", sell_value)
| name |
sell_value |
buy_value |
category |
image |
| Brachio Skull |
6000 |
NA |
Fossils |
 |
| T. Rex Skull |
6000 |
NA |
Fossils |
 |
| Brachio Chest |
5500 |
NA |
Fossils |
 |
| Brachio Tail |
5500 |
NA |
Fossils |
 |
| Dimetrodon Skull |
5500 |
NA |
Fossils |
 |
| Right Megalo Side |
5500 |
NA |
Fossils |
 |
| T. Rex Torso |
5500 |
NA |
Fossils |
 |
| Tricera Skull |
5500 |
NA |
Fossils |
 |
| Brachio Pelvis |
5000 |
NA |
Fossils |
 |
| Dimetrodon Torso |
5000 |
NA |
Fossils |
 |
| Diplo Skull |
5000 |
NA |
Fossils |
 |
| Diplo Tail |
5000 |
NA |
Fossils |
 |
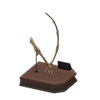
| Left Quetzal Wing |
5000 |
NA |
Fossils |
 |
| Right Quetzal Wing |
5000 |
NA |
Fossils |
 |
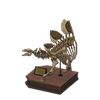
| Stego Skull |
5000 |
NA |
Fossils |
 |
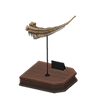
| T. Rex Tail |
5000 |
NA |
Fossils |
 |
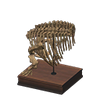
| Tricera Torso |
5000 |
NA |
Fossils |
 |
Priceless Items by Category
items %>%
  filter(is.na(buy_value)) %>%
  ggplot(aes(x=category)) + geom_bar() +
  theme(axis.text.x = element_text(angle=90))

library(ggalluvial)

pers_vil %>% filter(species %in% c("cat", "rabbit", "dog")) %>%
ggplot(
       aes(y = count,
           axis1 = personality, axis2 = species)) +
           geom_alluvium(aes(fill = count),
                width = 0, knot.pos = 0, reverse = FALSE) +
  guides(fill = FALSE) +
  geom_stratum(width = 1/8, reverse = FALSE) +
    geom_text(stat = "stratum", infer.label = TRUE, reverse = FALSE)


